E-Commerce Data Warehouse
How can raw e-commerce records become a reliable foundation for revenue, customer, and delivery reporting?
01 / THE QUESTION
How can raw e-commerce records become a reliable foundation for revenue, customer, and delivery reporting?
02 / THE APPROACH
Transform approximately 10,000 simulated orders with Python / Pandas into a PostgreSQL star schema: one fact table and four dimensions. Validate row counts and connect the warehouse to SQL reporting and Power BI.
03 / THE RESULT
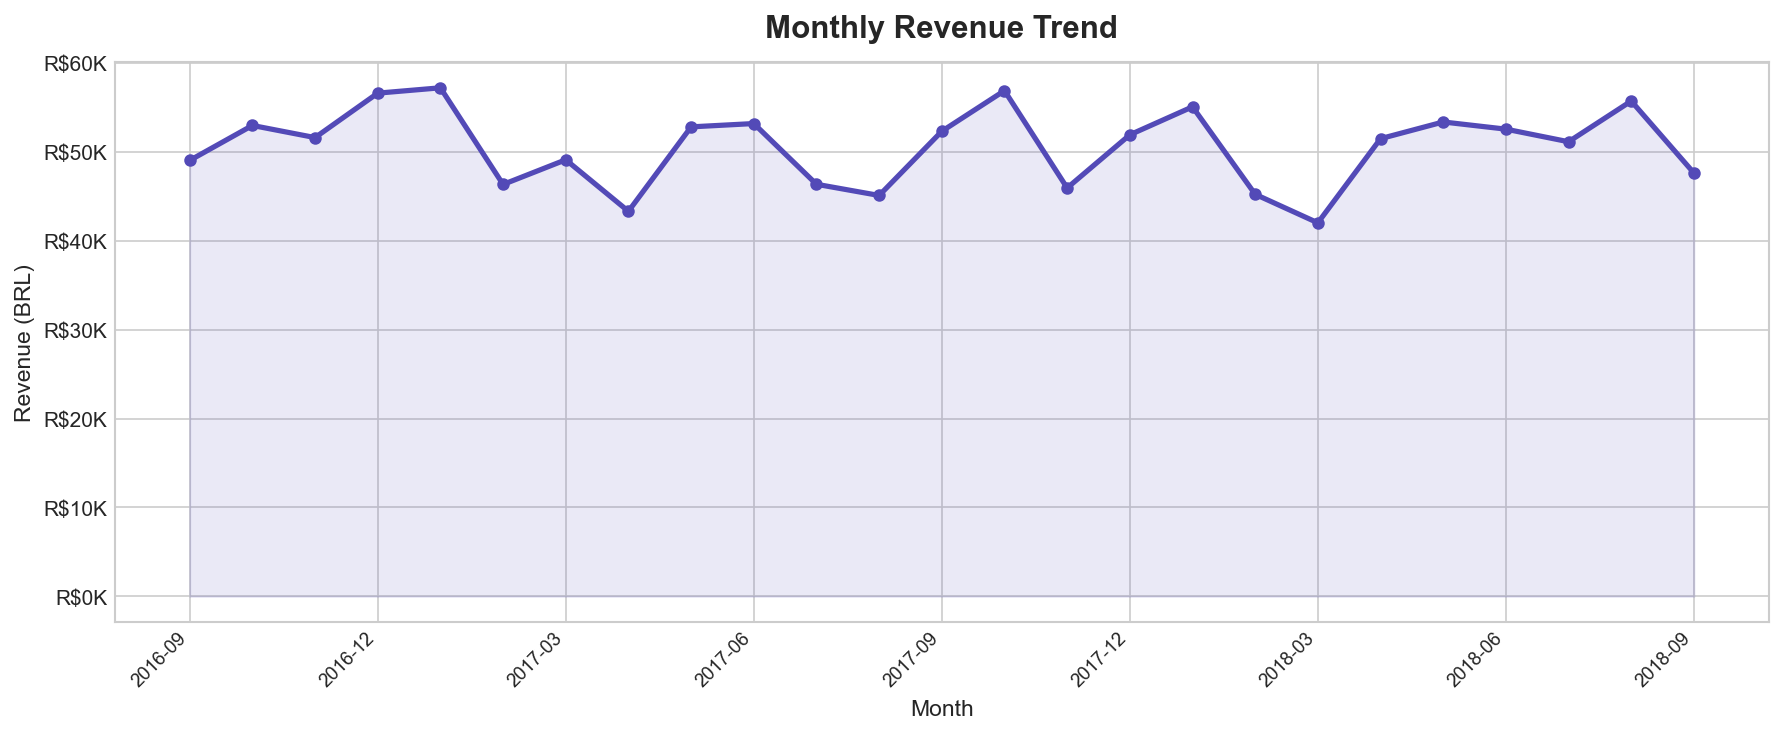
A reusable reporting foundation with 12 analytical SQL queries and project charts for monthly revenue, categories, payment methods, and delivery performance.
[ Project insights ]
EVIDENCE / FINDINGSReporting starts with the model
fact_orders links to customer, product, seller, and date dimensions. This five-table structure brings the business entities together for consistent reporting.
Beyond a revenue total
The analytical queries use LAG for period-over-period growth, NTILE for segmentation, and category revenue pivots to make comparisons possible rather than stopping at aggregate sales.
Validate before visualizing
The PostgreSQL loading script includes row-count validation across the warehouse tables. The accompanying charts surface revenue trends and logistics patterns in the simulated dataset.
CONTEXT / LIMITATIONS
The project uses simulated data, and the charts demonstrate reporting capability rather than business uplift. The Pandas pipeline is memory-bound at larger scales; the interactive dashboard requires Power BI Desktop.