HarshvardhanSINGH
[ Featured case study ]
01 — FORECASTING & CUSTOMER RETENTIONFinancial Operations Analytics
How can a SaaS business forecast revenue and identify valuable customers at risk of leaving?
01 / THE QUESTION
Forecast where SaaS revenue is heading and find the customers worth keeping before they churn — using five years of simulated activity from 5,000 customers.
02 / THE APPROACH
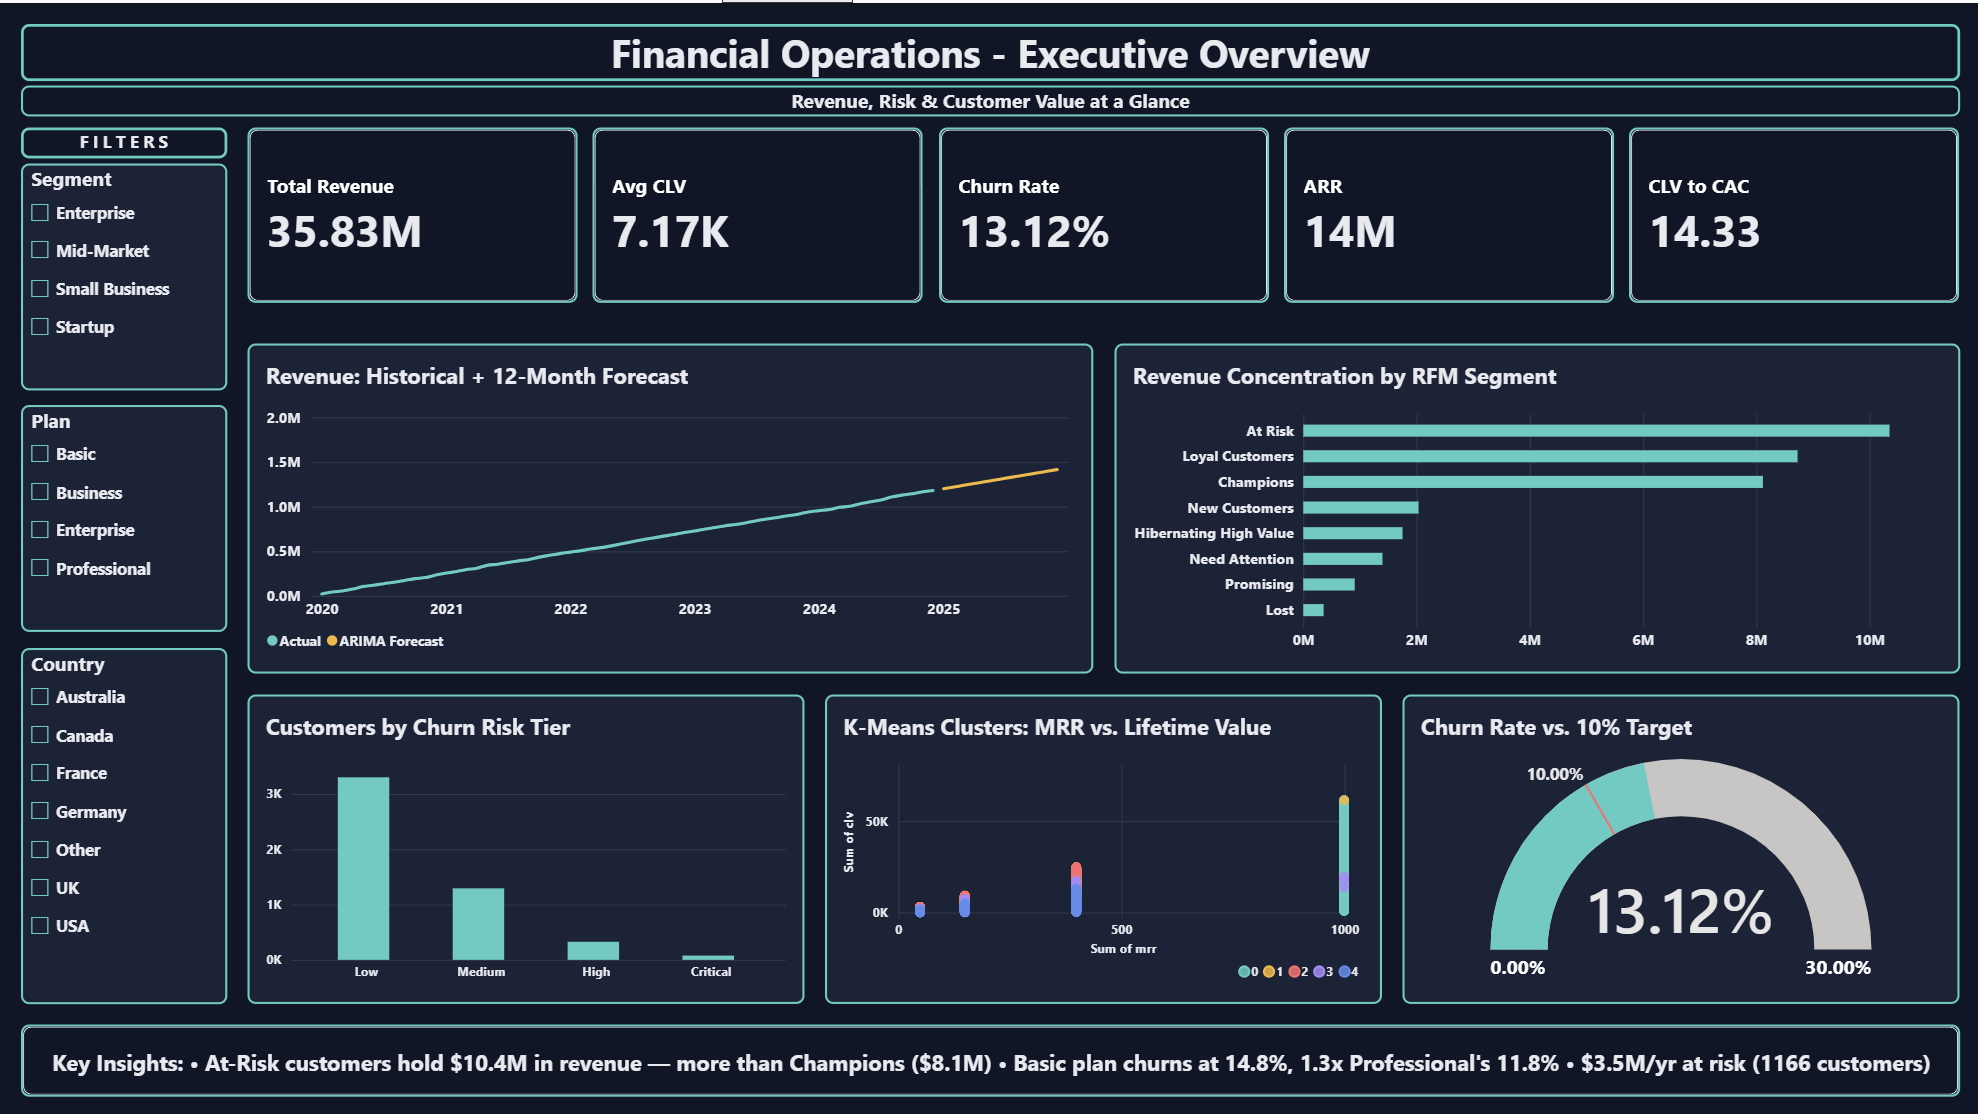
Analyze 135,218 transactions with ARIMA / Prophet forecasting, churn classification, RFM segmentation, and cohort retention, presented in a five-page Power BI dashboard.
03 / THE RESULT
A forecasting and retention workflow with a corrected churn model, customer risk rankings, and explicit checks for data leakage and cohort bias. All results are from synthetic data — a demonstration of analytical capability, not claimed business uplift.
[ A little context ]
02 — PROFILENumbers have
a story to tell.
I’m Harshvardhan, a data analyst based in Mumbai. My work explores the space between raw data and useful decisions — from customer behavior and financial forecasting to the systems that make reporting reliable.
[ More about me ↗ ]
[ Selected work ]
02 — PROJECT INDEXFinancial Operations
Analytics
Five years of simulated SaaS data. Revenue forecasting, churn prediction, and customer clustering — with an emphasis on finding and fixing data leakage.
[ View repository ↗ ]Retail & Marketing
Analytics
An analysis of 10,000 retail orders, connecting RFM segmentation, customer lifetime value, and cohort retention to practical business recommendations.
[ View repository ↗ ]E-Commerce
Data Warehouse
Raw e-commerce data transformed into a star schema: one fact table, four dimensions, a validated ETL pipeline, and a connected BI dashboard.
[ View repository ↗ ]