Financial Operations Analytics
How can a SaaS business forecast revenue and identify valuable customers at risk of leaving?
01 / THE QUESTION
How can a SaaS business forecast revenue and identify valuable customers at risk of leaving?
02 / THE APPROACH
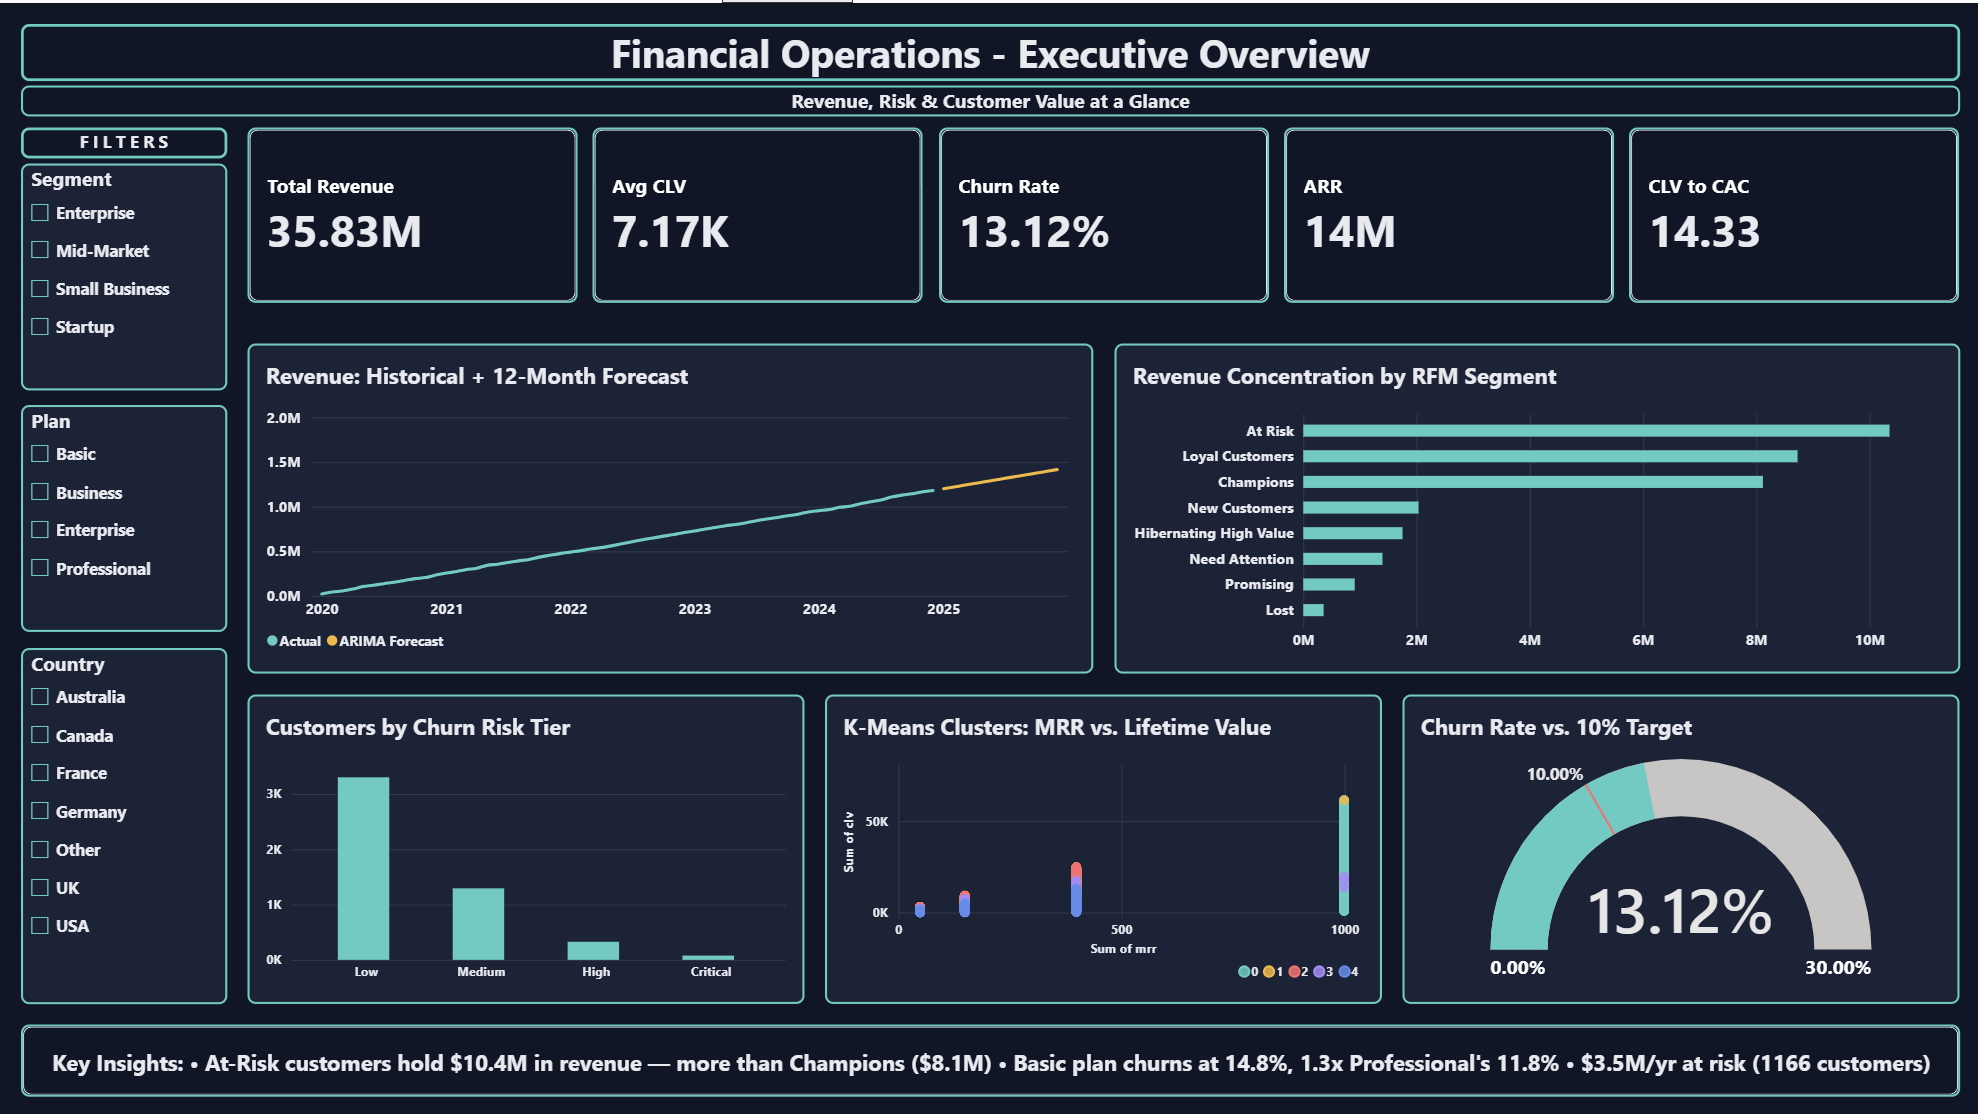
Analyze five years of synthetic SaaS activity across 5,000 customers and 135,218 transactions. Combine ARIMA / Prophet forecasting, churn classification, RFM segmentation, and cohort retention in a five-page Power BI dashboard.
03 / THE RESULT
A forecasting and retention workflow with a corrected churn model, customer risk rankings, and explicit checks for data leakage and cohort bias.
[ Project insights ]
EVIDENCE / FINDINGSA perfect score was a warning
The initial churn model scored 1.000 ROC AUC because several features encoded the outcome. Removing those features produced a more credible 0.756 ROC AUC with Gradient Boosting.
Retention deserves revenue context
The sample’s At Risk segment holds $10.4M in historical revenue versus $8.1M for Champions. The model also flags $3.5M/year across 1,166 active customers above a 15% churn-probability threshold; this is exposure, not recovered revenue.
Forecasts need a holdout
The repository reports 0.77% MAPE on held-out data for the revenue forecasting models. Cohort comparisons exclude cohorts under six months old to avoid overstating retention.
CONTEXT / LIMITATIONS
All revenue and model results are from synthetic data with a deliberately planted churn signal. Forecast performance is not a guarantee for real businesses; profitability uses a flat-margin assumption.