Uber NCR Ride Operations
Where are ride bookings lost, and how do cancellations and demand affect operations?
01 / THE QUESTION
Where are ride bookings lost, and how do cancellations and demand affect operations?
02 / THE APPROACH
Audit 150,000 Delhi NCR bookings with Python and Pandas, build a Power BI star schema, and document a seven-page report alongside requirements and UAT evidence.
03 / THE RESULT
A documented operations analysis showing 62.0% completion and approximately ₹24.4M estimated revenue exposure in the sample.
[ Project insights ]
EVIDENCE / FINDINGSCompletion is the first constraint
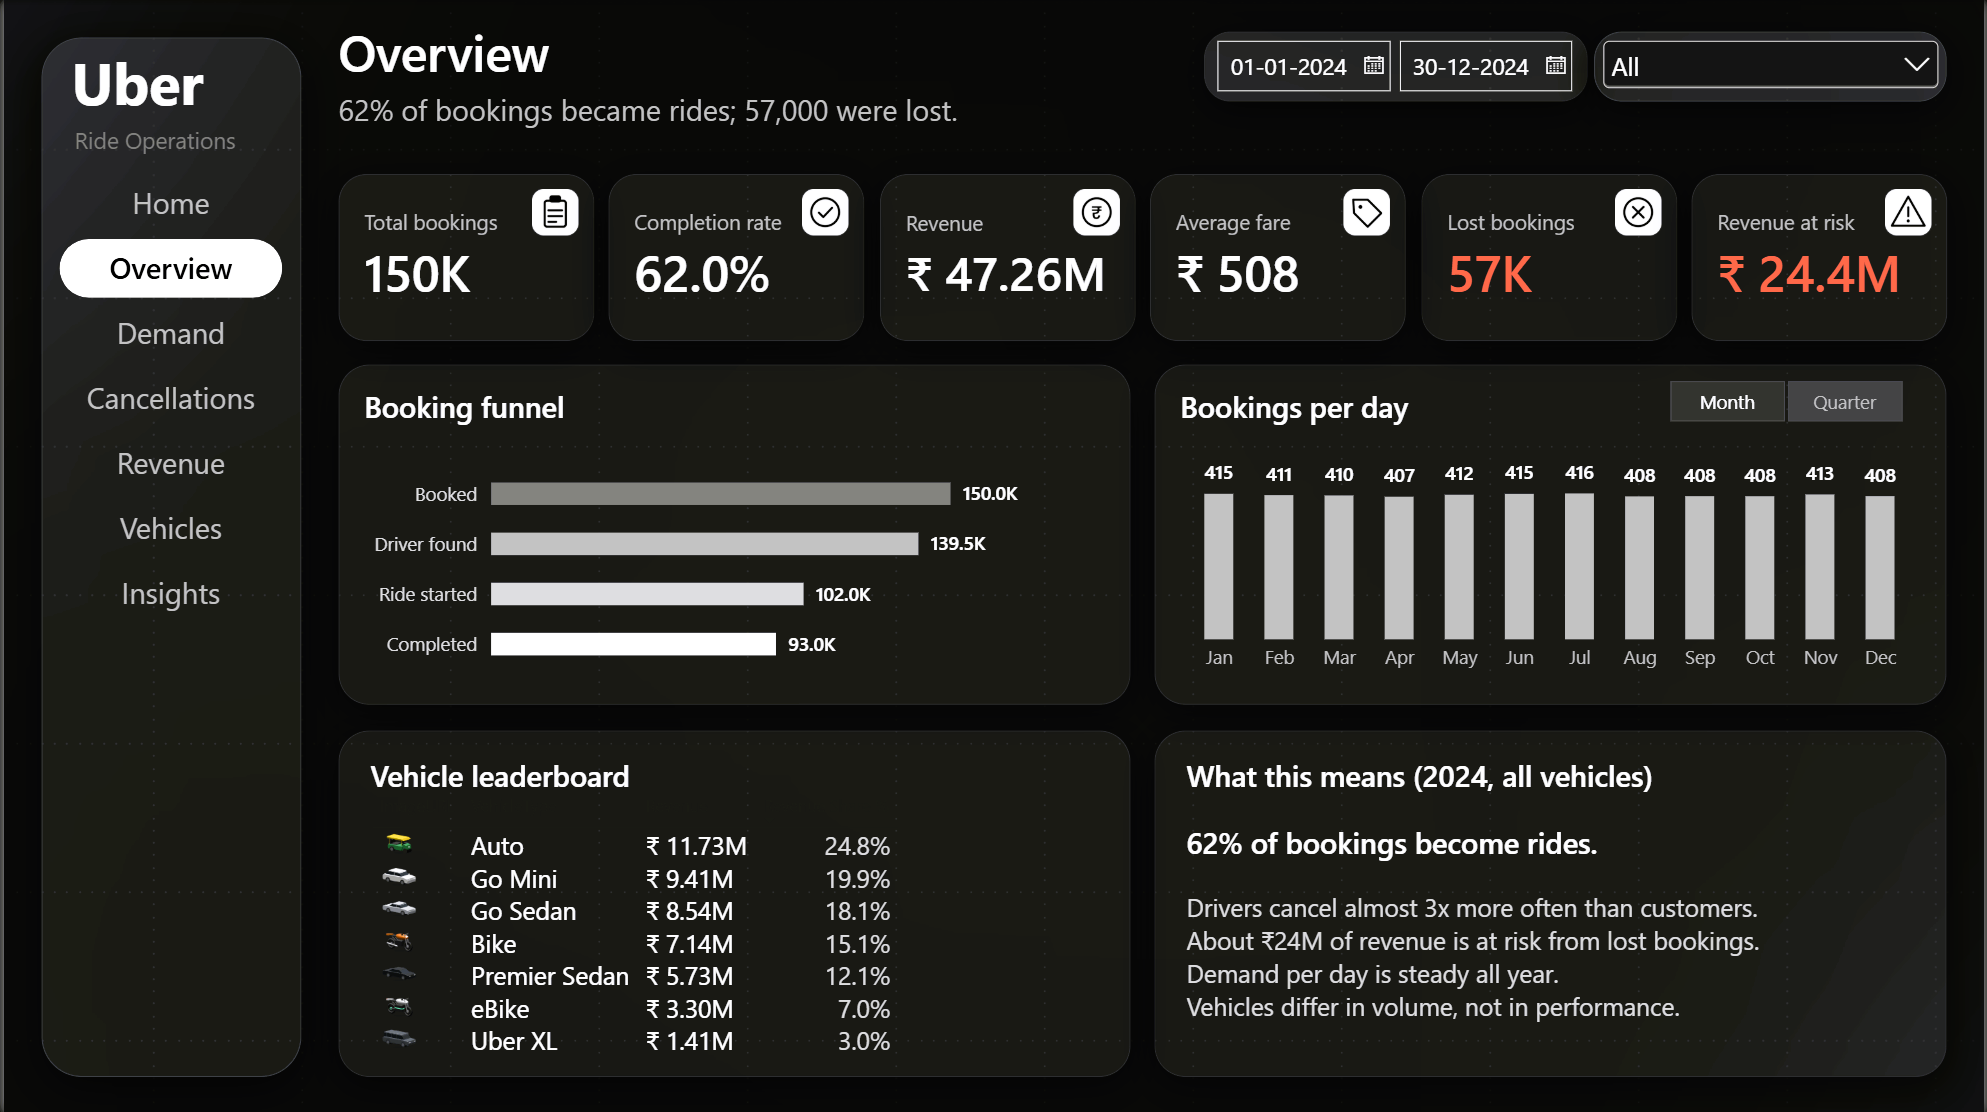
62.0% of the 150,000 bookings complete. The README reports 57K lost bookings across the sample, motivating investigation of cancellations and incomplete rides.
Exposure is not saved revenue
The report estimates ₹24.4M revenue at risk and ₹47.26M revenue in the dataset. The exposure figure is not actual lost or recovered Uber revenue.
Verification belongs with the report
Requirements and a UAT plan document the dashboard. Requirements were written after the build; they do not establish a pre-build acceptance process.
CONTEXT / LIMITATIONS
The Kaggle dataset appears synthetic and does not establish Uber’s real performance. Findings are descriptive; recommendations have no measured commercial uplift.